

Ultimate Beginner’s Guide to Google Analytics (2019 Interface)
If you’ve ever taken a quick peek at Google Analytics, you were probably thinking to yourself, “What is going on here? Where do I even begin?”
Even if you’ve taken more than a quick look, this analytics and tracking giant can be quite overwhelming.
You need to know where to click and what you need to do exactly to find the reports that are most important to you and your website. You don’t want to miss out on information that could mean more money in your pocket.
Don’t worry – once you get to know the Google Analytics dashboard and all it has to offer, you’ll become an expert in no time. In this beginner’s guide, we’ll show you everything you need to know. You’ll learn to install Google Analytics on your website, monitor your traffic, and much more.
Quick Google Analytics Glossary
Before we dive into the benefits of Google Analytics, here is a quick glossary of terms used throughout the interface and in this post.
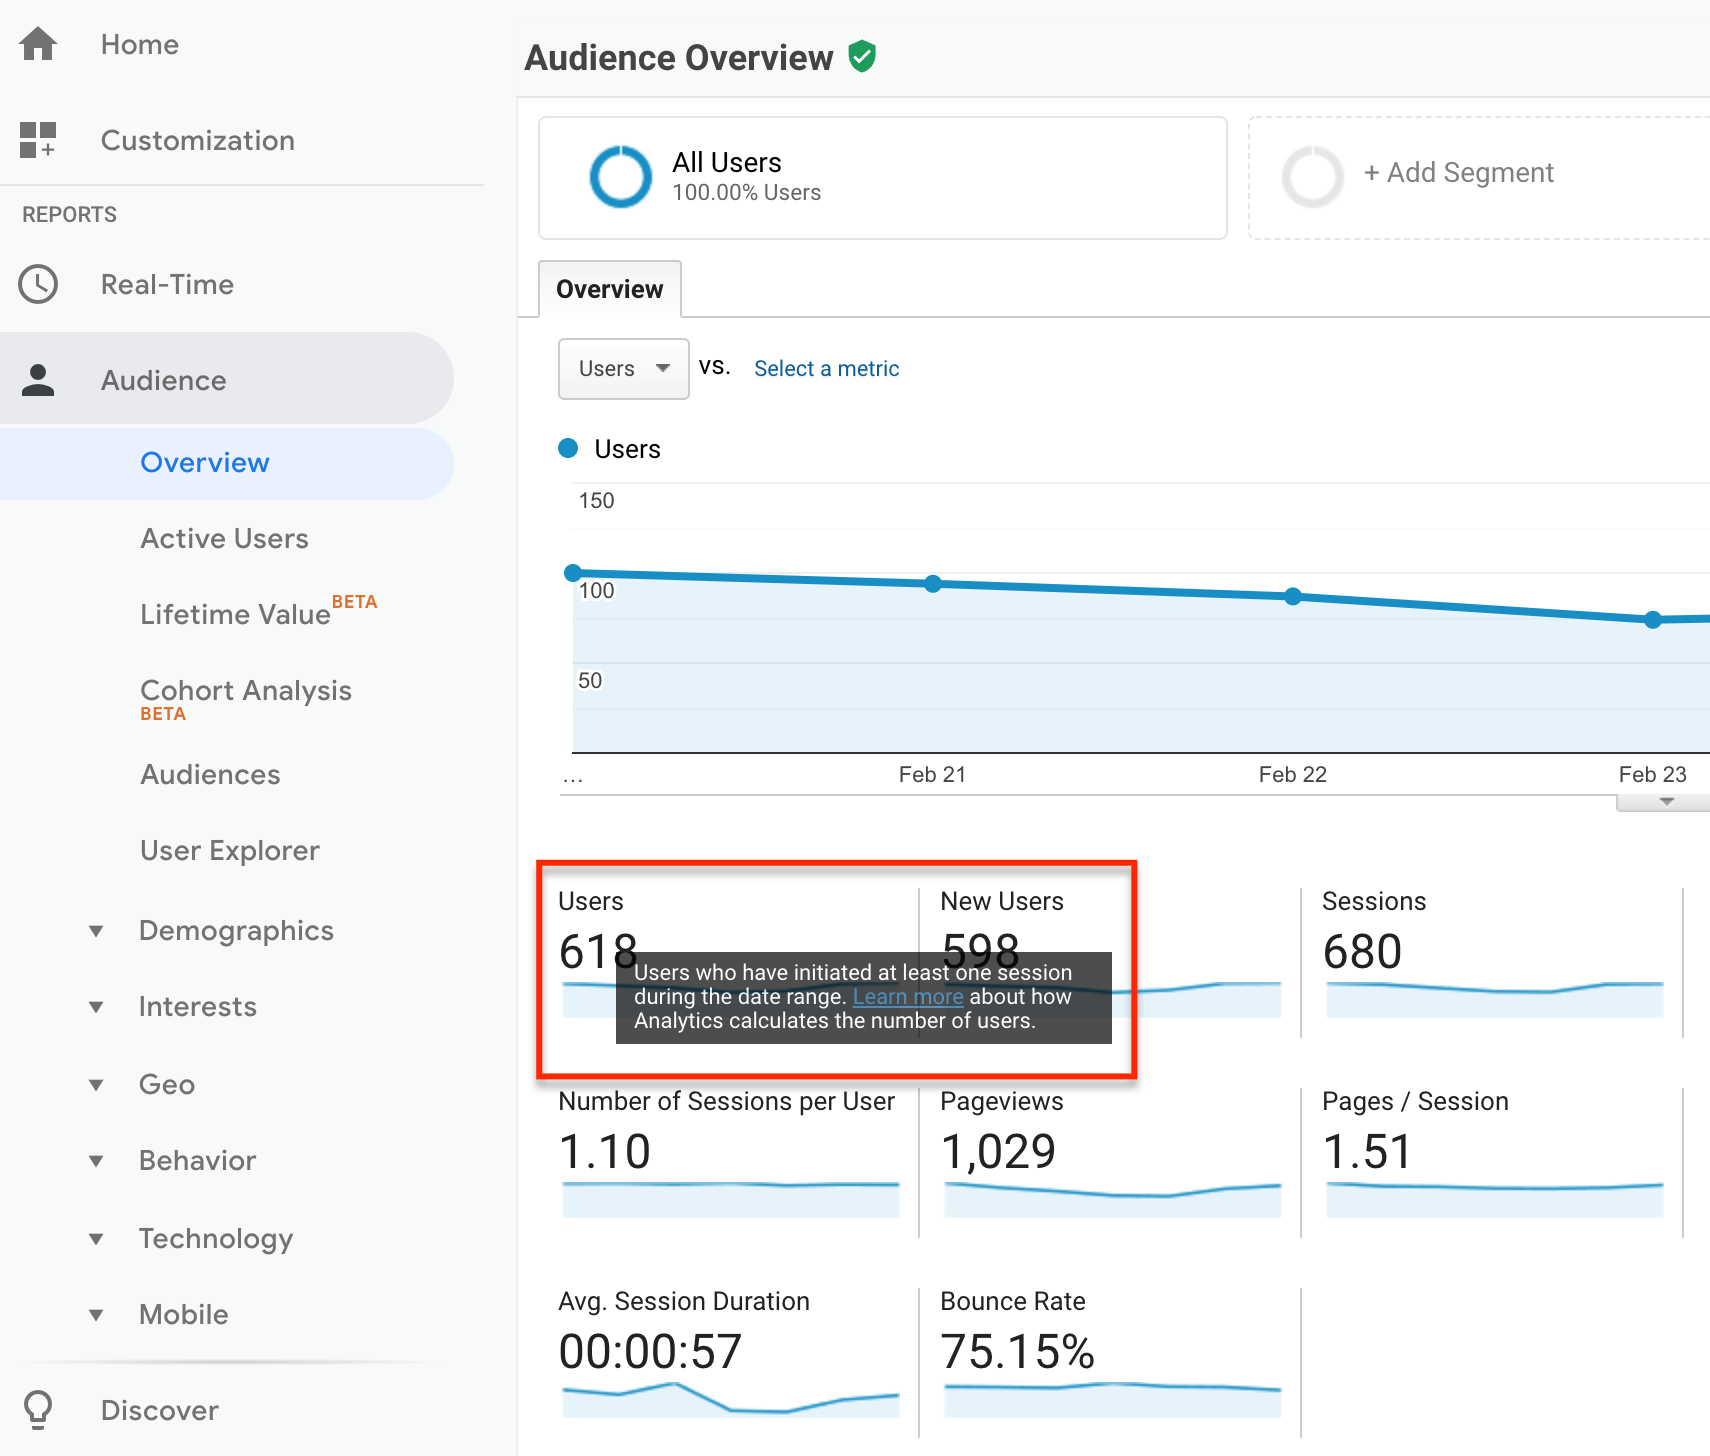
Users – Users and Active Users show how many website visitors or app users initiated at least one session on your website or app during a selected date range.
Reports – Google Analytics offers over 50 free reports and the ability to create custom reports to help you analyze demographics and behavioral data about your website and/or app users.
Sessions – Sessions show the period of time a user is actively engaged with your website or app during a selected date range.
Traffic Sources – This shows how users discover your website or app through organic search, paid search, referral websites, and direct traffic traffic channels.
Direct Traffic – Direct Traffic is when a user starts a session on your website without coming from a trackable traffic source, such as someone typing your URL into their browser instead of clicking on your website link from Google search results.
Campaigns – Campaigns track specific ways users discover your website or app. Google Analytics tracks campaigns created by Google AdWords Ad Campaigns and custom campaigns you create to track specific groups of traffic sources.
Pageviews – The total number of pages visited on your website or app during a selected date range.
Pages / Session – The average number of pages visited per session during a selected date range, including repeated views of a single page.
Bounce Rate – The percentage of sessions during a selected date range where a user visited one page on your website or app and exited without interacting with any elements on the page.
Audiences – Custom groups of users which you create to help identify specific types of users in Google Analytics reports, remarketing efforts, Google AdWords ad campaigns, and other Google webmaster tools.
Conversions & Goals – Goals measure specific objectives that you define as valuable for your business, such as a purchase from your online store or submission of a quote request form. Conversions represent the number of times users of your website or app complete each of your defined goals.
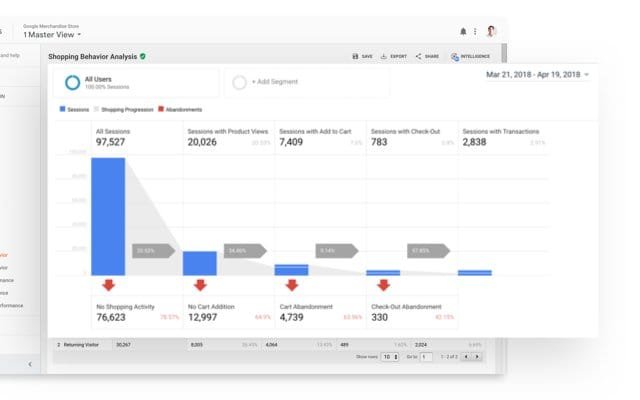
Funnels – The path users take to complete a goal.
There’s no need to memorize all of these. If you get stuck in Google Analytics, you can hover over most terms to see a pop-up description box.
You can also click on the question mark at the top right of any Google Analytics screen to access Google Analytics Help Center and search for specific terms and help information.
How to Set Up Google Analytics…


Leading with a security-first mentality
As technology rapidly develops, the number of security and privacy concerns will only continue …